
Get My Troubleshooting Profile
- Laura Chappell

- Jun 24, 2019
- 3 min read
Updated: Apr 12, 2022
NOTE: I updated the link (and broke it for a few minutes). The new profile I put up there also has the Wireshark v3 UDP Delta Time measurement column (added to TCP Delta Time column). Sorry for the broken link! It's fixed now!
At Cisco Live US, I showed attendees how to create a profile and popped up a view of one of my Troubleshooting profiles. Watching the eyes widen and the cell phones appear to take pictures of the profile setup, I realized there was a strong desire to have a pre-made troubleshooting profile.
Well… here you go!
Click HERE to download the Troubleshooting - Laura Chappell" profile.
This “Troubleshooting - Laura Chappell” profile is primarily geared towards troubleshooting TCP communications with a buttons to detect application errors, as well.
The profile has 5 elements of interest
Custom Columns
Buttons
Coloring Rules
I/O Graph
TCP preference setting
Go ahead and import the profile into your copy of Wireshark and then check out some of my notes in this blog about the elements of interest.
WANT TO LEARN MORE? We offer on-demand, online and instructor-led courses on Wireshark and TCP/IP communications! Check out the links under "Training" on the menu for more information!
How to Import My Profile into Your Copy of Wireshark
In Wireshark, profiles are made up of a simple set of text files. They reside in a directory that uses the profile name. This directory resides within a \profiles directory in your personal configuration folder.
[personal configuration folder]\profiles\[your_profile_directory_goes_here]
Follow the steps below to import my profile.
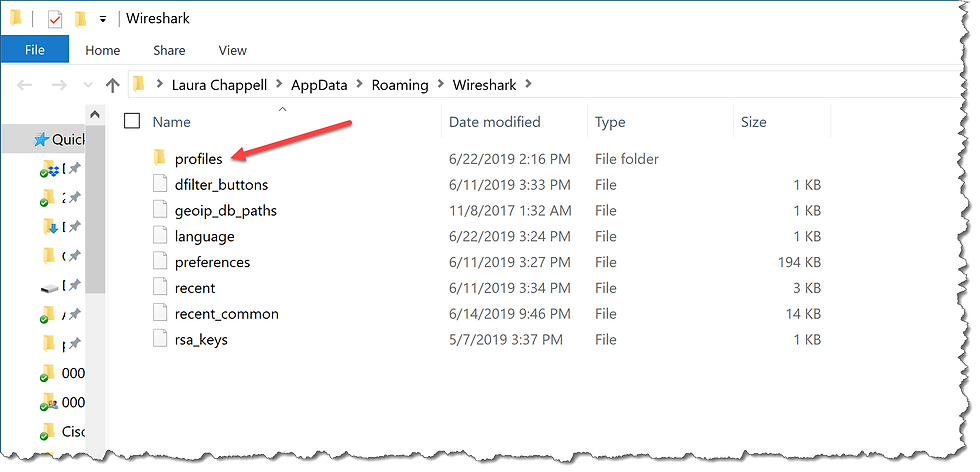
Step 1: Download and unzip my profile. My profile consists of a directory containing several files, as shown below.

Step 2: In Wireshark, select Help | About Wireshark | Folders and double click on the hyperlink for your Personal configuration folder.

Step 3: Copy my “Troubleshooting - Laura Chappell” directory into your \profiles directory.
Step 4: Back in Wireshark, click on the Profile column on the Status Bar and select your new “Troubleshooting - Laura Chappell” profile!
What’s Cool in this Troubleshooting Profile?
This profile contains some of my favorite buttons, columns and coloring rules.
Custom Columns
Right click on any column heading and you’ll see the list of custom columns that I added to this profile. Click on a column title to show/hide the column.
My columns are grouped by type, mostly. If you want to change the order of the columns, select Edit | Preferences | Columns.

Buttons
On the right side of the Display Filter toolbar, you will see a set of buttons that can detect the following traffic in your trace file.
Slow DNS responses
Slow HTTP responses
Slow SMB/SMB2/SMB3 responses
HTTP redirections
Delays within a TCP stream
High path latency (Initial Round Trip Time)
SYN and SYN/ACK packets
HTTP, DNS, or SMB/SMB2/SMB3 error responses

I used the arbitrary value of .5 (500 milliseconds) to define “slow” in my DNS, HTTP, and SMB delay detection buttons. I used the arbitrary value of .3 (300 milliseconds) to define “slow” in my TCP stream and iRTT delay buttons.
If you want to change any of the values, simply right click on the button and select Edit. Alter the time shown in the filter on which that button is based.
Coloring Rules
I’ve only added one coloring rule to this profile. I spend a lot more time using buttons, but I figured I would show how a single coloring rule can help you detect something you might miss otherwise.
The added coloring rule detects and colorizes DNS retransmissions based on a dns.retransmissions==1 display filter.

I/O Graph
Did you know that you can save I/O Graph settings within your profile? In fact, you can build numerous profiles and set up separate I/O Graphs for each. For example, I’ve given you troubleshooting I/O Graph within the “Troubleshooting - Laura Chappell” profile. If you need a “VoIP Analysis I/O Graph,” simply create a new profile and configure a graph based on VoIP traits.
I/O graph settings are saved in the io_graphs file within each profile.
My troubleshooting I/O Graph file graphs the following:
All packets
TCP errors
Maximum ACK Round Trip Time (RTT)
High Initial Round Trip Time (iRTT)
High TCP delta time
Application errors
In my custom IO graph, I have provided two ways to detect delays. One option is to use the Max (Y Field) graphing option (Maximum ACK RTT) and just graph all the maximum values seen per second. The second option is to define a delay value within the display filter and plot the number of times that time was seen.

TCP Preference Setting
Although Wireshark has the TCP reassembly preference setting enabled by default, I prefer to keep it disabled. This is required to measure the HTTP application response time accurately. That’s important since I have a button to detect HTTP delays.
If you want to enable this setting, right click on a TCP header in the Packet Details pane and select Protocol Preferences, as shown in the image below.

There you go! You now have a profile to use when troubleshooting network communications. Continue to customize this profile to meet your personal needs!
Enjoy!
-Laura

